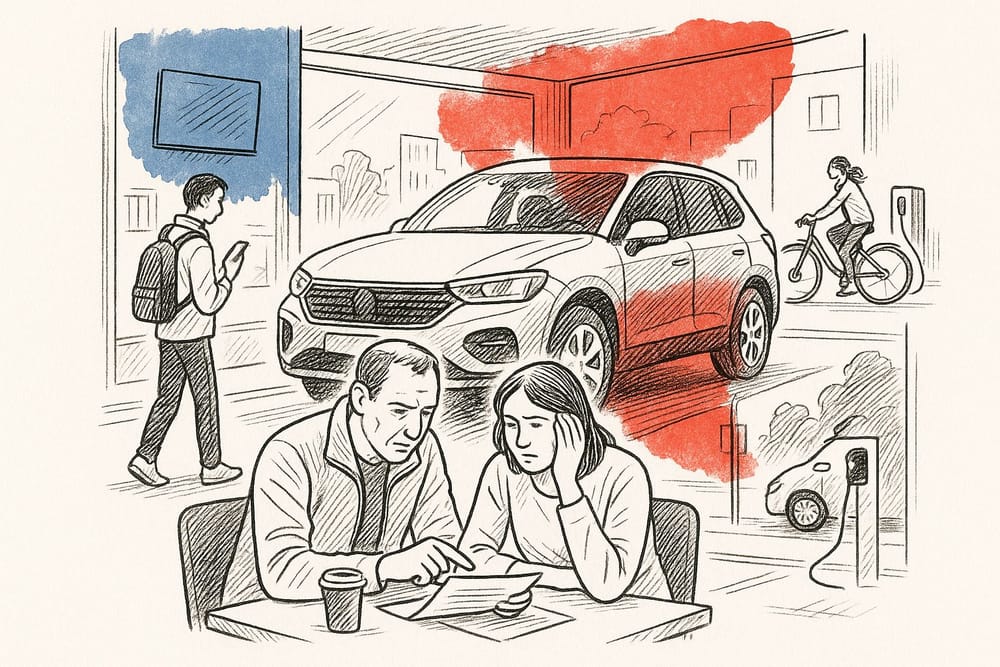
In peri-urban and rural areas, 87% of journeys are made by car [3]. For the most modest households, this means dedicating 21.3% of available income to mobility [5]—twice what the wealthiest 10% spend. In 2025, fifteen million French people face mobility precarity [2]. The 2027 decision is structural: allocate a share of national tax revenue to regions and transfer full local rail competency to them, or allow automotive dependence to persist—something that neither low-emission zones nor fuel vouchers are resolving.
Thirty years of sprawl have created an incompressible constraint
Suburbanization began in France in the 1970s. The mechanism is precise: housing left urban centers while employment concentrated there. France had 23.3 million registered vehicles in 1990. On January 1, 2024, it had 39.3 million—nearly 16 million more [1].
In 2024, cars account for 82% of domestic passenger transport in France [2]. This share was 83.4% in 1995. Over thirty years, it has barely shifted. Outside major metropolitan areas, dependence is even stronger: 87% of journeys in rural and peri-urban zones are made by car, versus 54% in urban areas [3].
The home-to-work distance has grown structurally. Between 2000 and 2020, the median distance increased by 4.4 km for workers living in rural areas, compared to 2.3 km for the workforce overall [4]. This lengthening reflects both suburbanization and employment concentration in urban hubs.
This geography traces a clear social fault line. In 2018, car ownership rates reached 92.9% in peri-urban areas and 95.8% in rural areas, compared to 74.4% in city centers [3]. The car is a necessity where alternatives do not exist.
In 2021, transport absorbed 21.3% of available income for the poorest 10% of households [5]. The wealthiest 10% devoted 11% to it. In peri-urban zones, households living on the fringes spent an average of 5,420 euros per year on mobility, or 14.7% of available income [5].
In 2025, 15 million people in France face mobility precarity [2]. This reality has a direct political translation. Among the 20% and 40% of most disadvantaged communes, Le Pen and Macron received more votes than Mélenchon [6]. These territories vote their mobility constraints as much as their convictions.
Two policies designed for metropolitan areas first strike those with no choice
Two transformations are simultaneously reshaping peri-urban mobility. No public policy instrument yet accounts for both.
The 2021 Climate and Resilience Act set the target of net-zero land artificialization. ZAN aims to halve, by 2031, the consumption of natural, agricultural, and forest land compared to the 2011-2021 decade [7]. Between 1960 and 2010, 2.5 million hectares had been consumed by suburbanization [7]. Slowing this sprawl without building denser housing in urban hubs blocks working-class access to housing.
Low-emission zones worsen the constraint on those same households. By end of 2024, France had 12 low-emission zones [8]. Since January 1, 2025, 30 new low-emission zones were created in cities with more than 150,000 inhabitants [8].
The distributive trap of low-emission zones is documented. In 2024, 38% of the poorest households owned a Crit’Air 4 or 5 vehicle, versus 10% of the wealthiest [8]. An analysis of the Global Transport Survey published in 2025 shows that journeys by the poorest 20% account for only 9% of automotive pollution [8].
The causal chain is this: modest peri-urban households were forced into cars by housing policy that made city centers inaccessible. Low-emission zones then penalize old vehicles they cannot replace without assistance. Eliminating low-emission zones in the name of social justice treats the symptom while worsening the cause: air pollution strikes first the most exposed populations, often the same ones.
Telework produces a paradoxical effect on mobility. In 2019, it concerned only 4% of workers. In 2024, 22% of private-sector employees practiced it at least once a month, averaging 1.9 days per week [9]. The effect on kilometers traveled remains ambiguous.
In 2024, teleworkers lived on average 28 km from their workplace, compared to 14 km for non-teleworkers [9]. France Stratégie estimates that 37% of moving plans are influenced by the possibility of teleworking [10]. Telework partially lengthens distances by enabling greater distance, without eliminating it.
It benefits chiefly upper-level employees. In 2024, 61% of jobs requiring a bachelor’s degree or higher, among workers aged 30 to 49, are teleworkable [9]. For the less educated, this rate drops to 16.5% [9]. Peri-urban blue-collar and service workers, first captives of the car, do not telework.
A comfortable transport budget overall, but unbalanced in its distribution
In 2024, public administration spending on transport amounts to 78.7 billion euros, or 2.7% of GDP [11]. This figure appears comfortable.
Excluding pension obligations, public transport spending represents 2.1% of GDP in 2024 [11]. The eurozone average stands at 2.4%, the European Union average at 2.5% [11]. This is one of the rare domains where French public spending falls below European averages. In 2024, Germany and Italy increased their annual spending by roughly 30% to renew and modernize their rail infrastructure [12].
In 2024, road transport accounts for 67% of total transport spending in France [11]. Investment spending on infrastructure rose 3.9% to reach 27.3 billion euros [11]. This increase benefits dense networks primarily. In 2024, 20 million French people live in territories where transport supply is insufficient [2]. Among them, 85.3% are more than ten minutes from a train station [3].
These 78.7 billion euros are distributed among three levels (State, AFITF, local authorities) without explicit priority for daily mobility in sparsely populated areas [11]. Budget pressure falls first on AFITF, whose resources depend on earmarked revenue (fuel excise tax, state property fees, radar fines) that no longer grows automatically. Redeployment without additional net investment is possible, provided the logic of major projects that has structured transport policy for forty years is challenged.
Transfer local rail competency to regions, with a constitutionally earmarked fiscal resource
Mobility precarity is first manufactured by decision-making architecture. The State funds major corridors while local mobility authorities survive on negotiable allocations with each annual budget law. Centralized funding subject to annual national budget arbitrage cannot produce stable, localized infrastructure policy. Dani Rodrik documents this mechanism for territorial development policies in Shared Prosperity in a Fractured World [14].
The choice to be made is as follows. A portion of the fuel excise tax (TICPE) would be constitutionally earmarked to regions. The allocation key: the share of their population living more than ten minutes from a train station [3]. At the same time, regions would gain full competency over rail lines under 150 km, including negotiation of slots with SNCF Réseau, currently reserved to the State.
Regions would become project managers, not recipients of discretionary subsidies. In return, they would lose the freedom to not organize supply. The right to a transport alternative would become enforceable for any worker living in a municipality without regular service to the nearest employment hub.
This choice has a clear cost. The fuel excise tax earmarked to regions is no longer available for AFITF. This slows major high-speed rail projects that some regions want. Less fiscally endowed regions widen an investment capacity gap. National equalization must explicitly compensate, inscribed in law, not left to the next government’s discretion.
The institutional lock stems from fragmented decision-making across dozens of levels with no clear authority. Klein and Thompson describe this for the United States in Abundance [13]: no regional rail investment produces expected effects as long as competency remains uncertain. Without stable earmarked resources, private on-demand transport platforms fill the void according to their own profitability logic. Acemoglu and Johnson show that these technologies create guaranteed service only if a public institution sets rules and ensures continuity [15].
Transferring competency without transferring resources is cosmetic reform. Transferring both means betting that regions will make different choices than the State, and accepting that some will make worse ones. This is the price of architecture.
Sources
[1] CEREMA, “Rural and peri-urban territories: keys to succeeding in your mobility project,” 2024, https://www.cerema.fr/fr/actualites/territoires-ruraux-peri-urbains-cles-reussir-son-projet (accessed 09/08/2026).
[2] CEREMA, “Observatory of Local Mobility Policies: 2025 Data,” July 2025, https://www.cerema.fr/fr/actualites/observatoire-politiques-locales-mobilite-donnees-2025 (accessed 09/08/2026).
[3] CEREMA, “Daily Mobilities: Trends and Lessons from EMC² Surveys,” November 2025, https://www.cerema.fr/fr/actualites/mobilites-quotidien-tendances-enseignements-partir (accessed 09/08/2026).
[4] INSEE, “Median commute distance increases by half in twenty years for rural inhabitants,” INSEE Première no. 1948, May 2023, https://mobilites-durables.transports.gouv.fr/indicateurs/details/parts-modales-classes-distance/methodo/ (accessed 09/08/2026).
[5] INSEE, “In 2017, households dedicate 11% of available income to the car,” INSEE Première no. 1855, April 2021, https://www.insee.fr/fr/statistiques/5358250 (accessed 09/08/2026).
[6] Fondapol, “Economic and social structure of territories and populist voting in France,” November 2024, https://www.fondapol.org/etude/structure-economique-et-sociale-des-territoires-et-vote-populiste-en-france/ (accessed 09/08/2026).
[7] CEREMA / National Land Artificialization Observatory, Net-Zero Land Artificialization: Booklet, August 1, 2025, https://artificialisation.developpement-durable.gouv.fr/sites/artificialisation/files/fichiers/2025/08/ZAN_FASCICULE_1_44P_v20250801.pdf (accessed 09/08/2026).
[8] National Assembly / The Conversation, “Should low-emission zones be eliminated in the name of social justice?,” June 2025, https://theconversation.com/faut-il-supprimer-les-zones-a-faibles-emissions-au-nom-de-la-justice-sociale-259516 (accessed 09/08/2026).
[9] DARES, Beatriz M., Erb L., “How is telework practice evolving since the health crisis?,” Dares Analyses no. 64, November 2024, https://dares.travail-emploi.gouv.fr/publication/comment-evolue-la-pratique-du-teletravail-depuis-la-crise-sanitaire (accessed 09/08/2026).
[10] France Stratégie, “Territorial impacts of telework,” Analysis Note no. 146, November 2024, https://www.strategie-plan.gouv.fr/files/2025-01/fs-2024-na146-teletravail-28_novembre_0.pdf (accessed 09/08/2026).
[11] SDES, Annual Transport Assessment 2024, November 2025, https://www.statistiques.developpement-durable.gouv.fr/bilan-annuel-des-transports-en-2024 (accessed 09/08/2026).
[12] Transport Regulatory Authority (ART), The European Rail Transport Market in 2024, June 2026, https://www.autorite-transports.fr/wp-content/uploads/2026/06/art-bilan-ferroviaire-france-europe-2024.pdf (accessed 09/08/2026).
[13] Ezra Klein and Derek Thompson, Abundance, 2025, https://en.wikipedia.org/wiki/Abundance_(Klein_and_Thompson_book) (accessed 09/08/2026).
[14] Dani Rodrik, Shared Prosperity in a Fractured World, Harvard, 2025, https://drodrik.scholars.harvard.edu/publications (accessed 09/08/2026).
[15] Daron Acemoglu and Simon Johnson, “Can A.I. Be Pro-Worker?,” The New Yorker, 2026, https://www.newyorker.com/contributors/john-cassidy (accessed 09/08/2026).