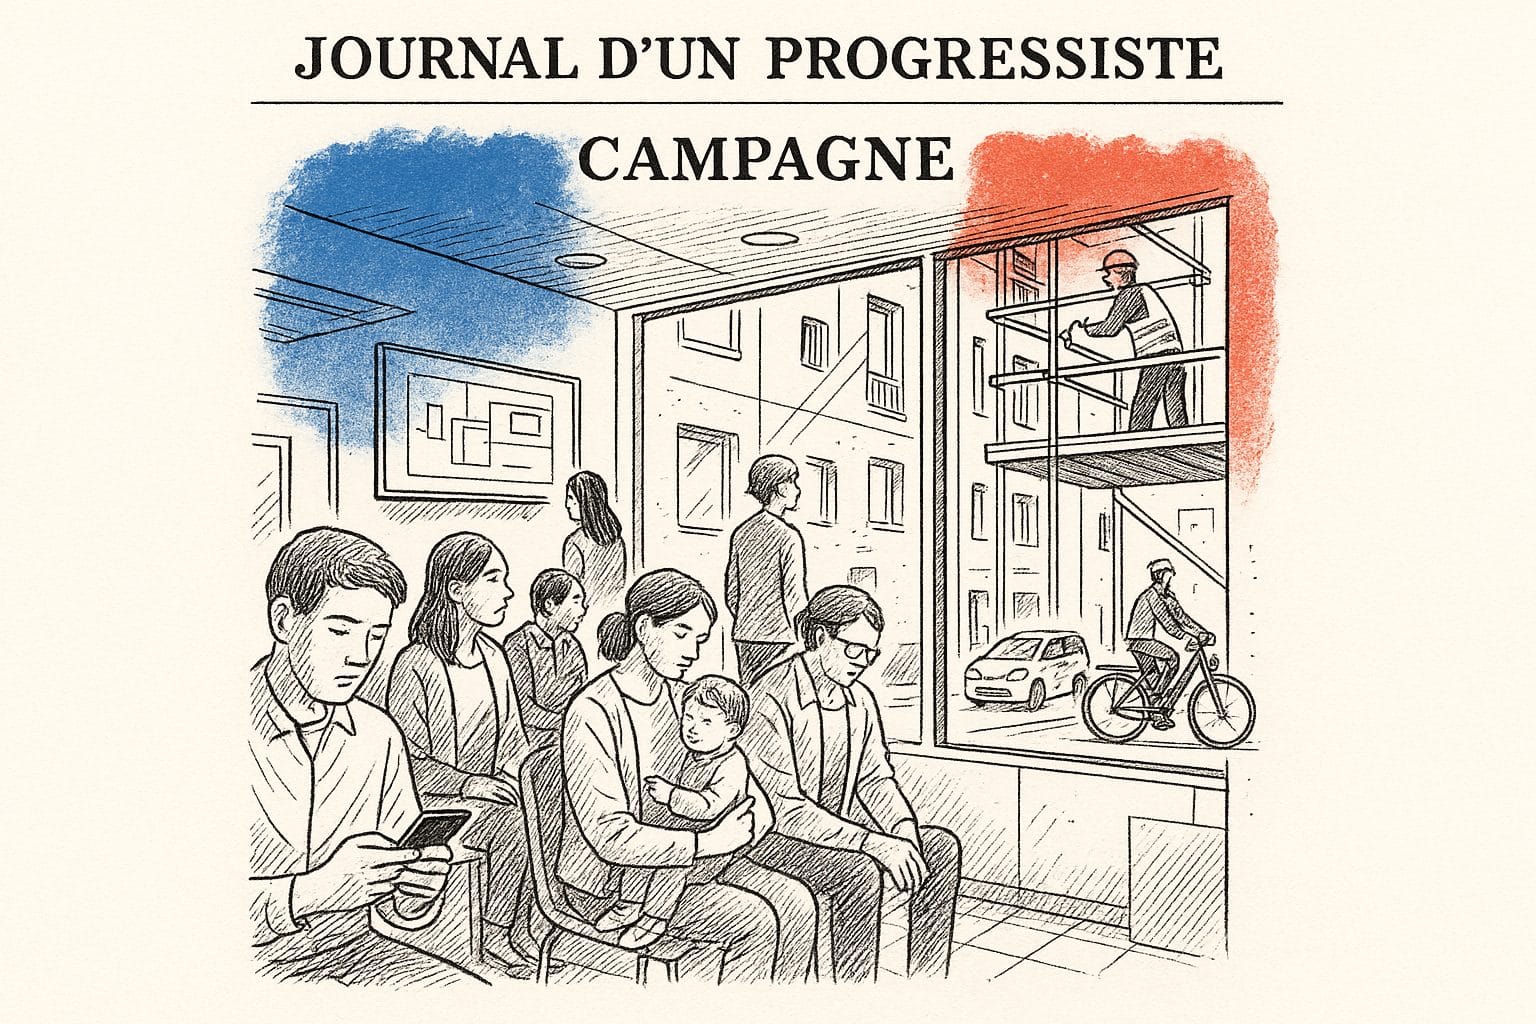
A population that stops growing can still generate sustained housing demand for decades. New Zealand illustrates this with rare methodological rigor: Stats NZ now projects families and households by age, sex, and composition type across its 16 regions, 67 territorial authorities, and 21 local councils in Auckland, according to multiple assumptions about fertility, mortality, migration, and lifestyle changes. This shift in measurement tools shows that planning based solely on population can miss the effects of household formation changes; household projections constitute an important complement for estimating needs.
The Essentials
- A reduction in average household size generates housing demand even when population stagnates: fewer people per household means more households are needed.
- Stats NZ projects families and households by age, sex, and composition type for 67 territorial authorities, according to multiple demographic scenarios (fertility, mortality, migration, lifestyle changes).
- Aging is the driving variable: single-person elderly households represent the fastest-growing household form in developed countries.
- Urban planning based solely on population projections systematically underestimates housing, transportation, and local services needs.
- The challenge for 2035-2050 is whether territorial policies will be able to plan based on the number of households rather than just the number of inhabitants.
Fewer Inhabitants, More Households
There is a counterintuitive arithmetic in the housing crisis in developed countries. A city can lose inhabitants and still have a housing shortage. A territory can see its population stagnate and still need to build thousands of additional units. The number and composition of households are central determinants of housing demand, supplemented by population, existing housing stock, vacancy rates, prices, and occupancy conditions.
Aging and changes in lifestyle can reduce average household size, but their importance and significance vary by country and period. Aging is one of the main drivers, whose importance varies by territory and lifestyle assumptions. Older people, particularly women at advanced ages, are more likely to live alone; widowhood is a major cause of living alone at advanced ages, while the motivations and duration of living alone differ by individual and context. A separation can increase the number of households, even without births, if it leads to the creation of two distinct households. Changes in couple status, separation, and cohabitation can increase or decrease the number of households depending on the context; youth leaving home does not evolve uniformly toward earlier departure.
Over a few decades, average household size has fallen in nearly all OECD countries, driving housing demand growth faster than population growth, sometimes even in the opposite direction.
New Zealand decided to measure this phenomenon with precision. The projections published by Stats NZ do not simply project how many people will live in each region over the next twenty years. They project how many households these people will form, how these households will be composed, and according to which scenarios this composition could evolve. This is a shift in analytical framework with direct implications for the entire urban planning chain: housing, infrastructure, transportation, local healthcare.
Aging Creates More Households Than Birthrates Erase
Demographers have long distinguished between natural population growth and migration-driven growth, but they speak less often of growth through household dissolution. Yet it is one of the most powerful dynamics at work in aging societies.
When a population ages, its households progressively fragment. Children leave the family home. Couples separate or lose one of their members. Multigenerational families, already rare in Anglo-Saxon countries, continue to decline. Some family changes can increase the number of households and potential housing demand, but the actual effect depends on cohabitation solutions, vacant housing stock, and housing forms.
In demographically declining regions, this phenomenon can mask latent housing crisis. A rural municipality losing inhabitants can simultaneously suffer from a shortage of housing adapted to elderly people living alone, because its housing stock was designed for families of three or four people. For housing, one must track household evolution and composition, in addition to components of demographic change, including natural increase.
This is exactly what Stats NZ’s approach enables. By projecting households by composition type, by age of household head, and by sex, the tool makes it possible to identify not only how many homes will be needed, but what types of homes. A young single-person household seeks affordable housing in the city center. An 80-year-old person living alone in a suburban area needs accessible housing, near medical services, served by adapted transportation. These two realities call for radically different urban planning responses, and they are invisible if one only looks at total population.
Sixteen Regions, Sixty-Seven Authorities, Multiple Possible Futures
The strength of the New Zealand method lies in its geographic resolution and its plurality of scenarios. Stats NZ does not produce an average national projection that would smooth over local disparities: it descends to 67 territorial authorities and 21 local councils in Auckland, crossing multiple assumptions about fertility, mortality, internal and international migration, and lifestyle change.
This granularity is as much political as analytical. Auckland and Wellington do not have the same demographic profile, nor the same aging rate, nor the same internal migration dynamics. A region like Northland, relatively rural and older than the national average, finds itself on a very different trajectory than Canterbury, which attracts migrants and young households. Projecting households at the national scale would mask these divergences and deprive local communities of the tools they need to anticipate.
Projecting under a single assumption creates an illusion of certainty. Projecting under multiple scenarios forces decision-makers to reason about ranges, to identify the most uncertain variables, and to design policies robust enough to function in several plausible futures.
Fertility is an important component of household projections via age structure; its relative importance depends on the territory, time horizon, and household type. Lifestyle change assumptions are important and can strongly modify household projections, but their relative weight varies by territory and scenario.
Lifestyle assumptions are uncertain and important, but no general rule allows them to be characterized as more difficult or influential than fertility, mortality, and migration. Household projections are generally more complex because they add lifestyle assumptions; they complement, without replacing, population projections.
A Persistent Gap in International Comparisons
New Zealand is not starting from scratch. The Australian Bureau of Statistics publishes regional population data allowing analysis by geographic zone, and several European countries have household registers allowing detailed analysis. But the combination of subregional resolution, decomposition by household type, and plurality of scenarios remains rare. In several countries, projections cover national population, sometimes regional, and local communities themselves deduce housing needs.
In aging areas, population projections not supplemented by household formation assumptions risk underestimating certain housing needs. Mayors and local elected officials make urban planning decisions spanning twenty or thirty years on bases that become obsolete in ten years.
Growth depends less on births than on women’s work: this observation applies to housing as well. What transforms real estate demand is less natality than individual autonomy, women’s participation in the labor market, the decline of traditional communal living. Social changes that pure population projections capture poorly, but that household projections can integrate once they model lifestyle changes.
France, for example, has household projections produced by INSEE, but their breakdown at sub-regional levels remains limited. Germany, facing accelerated aging and sharply contrasting internal migration dynamics between East and West, has obvious needs for planning at the Länder and municipality scale. Japan, where some prefectures lose a quarter of their population in twenty years while major metropolitan areas continue absorbing internal migrants, illustrates in the extreme the limits of urban planning based solely on aggregate demographics.
Planning 2035-2050 by Number of Households, Not Number of Heads
The question posed by the New Zealand approach transcends its borders. It interrogates the capacity of urban policies to integrate households and inhabitants in their planning: households are central to housing, while many services and transportation also depend directly on individual population characteristics.
This planning horizon to 2035-2050 raises several concrete questions that scenarios allow one to begin exploring. If aging accelerates and the proportion of single-person households exceeds 40% of the total in some regions, as could occur in rural areas and medium-sized cities, the need for small-unit housing increases, but so do needs for home services, adapted transportation, and local healthcare. A housing stock composed of 60% four-bedroom single-family homes, designed for families of the previous generation, becomes structurally unsuited, without a single square meter being demolished.
The opposite scenario also deserves examination. If sustained immigration policies, like those New Zealand has pursued for several decades, continue to attract young families to dynamic regions, household composition can evolve differently from one region to another within the same country. Auckland may find itself planning sustained demand for family housing while regions like the South Island’s west coast manage an aging stock and a growing number of single-person households. This divergence, invisible in a single national projection, becomes manageable if data exists at the local scale.
The benefits of remote work require a management change: remote work adds an additional variable to this territorial equation. The ability to work remotely has relaunched in several countries internal migration flows toward secondary cities or rural areas. This movement modifies household composition in receiving zones, which welcome active and often young households, and in departure zones, which find themselves with a residual, older population. Planning based on household projections can capture these shifts; planning based on total population misses them.
The most useful signal to follow in coming years will be the diffusion of this methodology. If other countries and local communities adopt high-resolution geographic household projections, urban planning decisions could gradually align with actual needs rather than population estimates whose limitations have been known for a long time. New Zealand offers a reproducible model, provided that national statistical agencies have the resources to deploy it and that local elected officials accept planning from data that complicates the picture, but renders it infinitely more legible.
Statistics as a Local Governance Tool
Stats NZ’s approach stands out for its methodological rigor and operational purpose. These projections are designed to be used by 67 territorial authorities and 21 local councils in Auckland in their planning decisions: where to build, how many units, what size, with what associated services.
This assumes a relationship between the national statistical agency and local communities that is not universal. In many countries, national demographic data rarely descends to the scale where urban planning decisions are actually made. Mayors plan with population figures from the last census, adjusted by locally produced estimates of variable quality. The result is planning in permanent misalignment with demographic reality.
The New Zealand approach rests on a wager: high-quality local data produces better local decisions. This wager is reasonable, but it calls for one condition. Local authorities must have the capacity to use this data, to integrate it into their urban plans, to update it when scenarios change. Statistics as a governance tool assumes teams capable of reading it and translating it into public policy. In small rural communities, this capacity may be lacking, even when data exists.
Stats NZ’s approach touches on the organization of territorial planning: at what level are housing decisions made, with what analytical resources, and with what capacity to anticipate demographic transformations playing out over a generation. Countries that answer these questions correctly will build the right units in the right place at the right time. Others will continue to suffer housing crises that neither demographics nor the market will have made inevitable.
Sources
- Stats NZ, Subnational Family and Household Projections
- Australian Bureau of Statistics, Regional population data
- INSEE, Projections de ménages pour la France métropolitaine