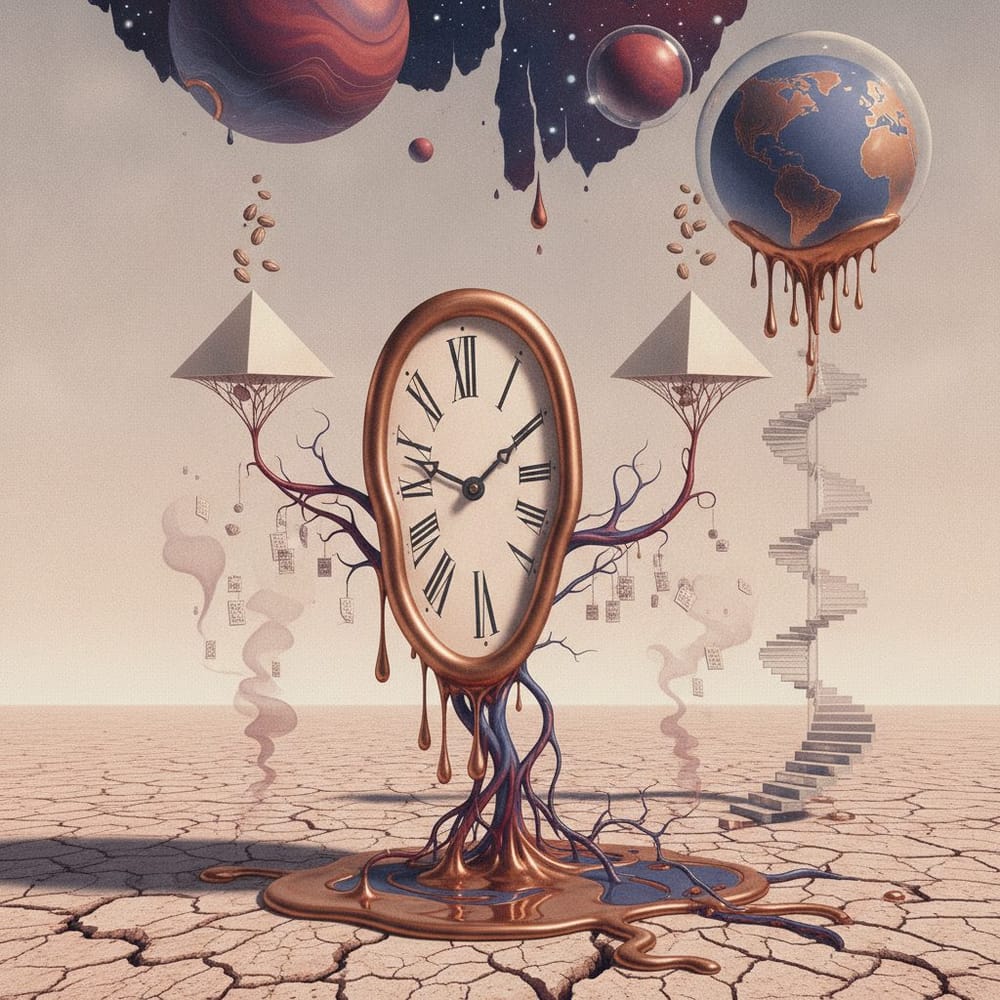
Over several decades, certain indicators of material accessibility have improved, while scientific assessments have documented degradation of ecological systems and growing risks to production; however, the scale and causalities depend on which indicators are selected. According to Human Progress, between 1980 and 2025, the average time-price of the 50 products in its basket declined by 70.9%. The Living Planet Index indicates an average decline of 73% in monitored vertebrate populations between 1970 and 2020; the CO2 concentration at Mauna Loa increased by approximately 29% between 1975 and 2025 according to NOAA. These two data series describe the same world without describing the same progress.
The Essentials
- The Simon Index measures real merchant abundance: between 1980 and 2025, all 50 products in the basket became more accessible in time-price terms according to Human Progress.
- The Living Planet Index estimates an average 73% decline in the size of monitored vertebrate populations between 1970 and 2020; it does not measure a decline in all global biodiversity. The annual atmospheric CO2 concentration at Mauna Loa increased by approximately 29% between 1975 and 2025; this does not describe an increase in emissions.
- The gap stems from a design flaw: time-price measures access to market goods, but many common goods and non-market ecosystem services lack a direct time-price, except when a price or valuation mechanism is assigned to them.
- The tension between these two readings of progress remains open; resolving it requires indicators capable of holding both dimensions simultaneously.
The Tupy Method and Its Scope
Marian Tupy, editorial director of HumanProgress.org, has defended for twenty years a thesis based on the original work of Julian Simon: in the Simon Abundance Index basket, the average time-price declined between 1980 and 2025. The “time price” (time price) eliminates monetary distortions and inflation. It answers a concrete question: how many minutes of average wages are needed to buy a liter of gasoline, a ton of copper, a kilogram of wheat. For the basket of 50 products tracked by Human Progress between 1980 and 2025, the average time-price declines sharply.
This result is robust. The 2025 Simon Index, named in tribute to the economist who bet with Paul Ehrlich in 1980 on falling metal prices and won, covers resources as diverse as grains, industrial metals, textile fibers, energy, and basic chemicals. The currently published series compares 1980 and 2025 and reports an average decline of 70.9% in the basket’s time-prices. Ten products are exceptions, and the index does not hide them. The central trend remains one of deepening abundance, not accelerating depletion.
Tupy’s thesis contains a demographic proposition that his critics often underestimate. A larger population can also increase the number of innovators: this is the thesis of “superabundance.” Every additional human is potentially a problem-solver. Resources are not fixed; they are defined by the technologies and institutions that allow for their extraction, substitution, or conservation. Petroleum replaced whale oil.
Synthetic nitrogen made it possible to feed a population that Malthus would have condemned to famine. Long-term history vindicates this reading.
Here, optimism is justified. For the basket and the measurement of the Simon Abundance Index, average accessibility has improved since 1980; generalization to all merchant resources is not established. Malnutrition rates have fallen, real food prices have collapsed, access to energy has widened. The decline in absolute poverty documented by Our World in Data over the same period is consistent with these price trends. The Simon Index captures something real.
Where Time-Price Does Not Look
The Simon Index does not lie. However, it covers only part of the picture.
Time-price measures the work effort required to acquire a good or service with a monetary price; it does not directly measure priceless services. It measures the cost of access to a ton of copper or a barrel of oil. It does not measure the cost of extraction on local aquifers, on forests that shelter watersheds, on species that appear in no ledger. Many ecological services are not traded on markets and thus have no direct time-price, even if valuation or payment mechanisms may exist. Their degradation does not drive up copper prices.
The figures are striking in their divergence. The 2024 Living Planet Index estimates an average 73% decline in monitored vertebrate populations between 1970 and 2020. Atmospheric CO2 concentration rose from approximately 330 parts per million in 1975 to over 420 today, a rise of nearly 30%, measured continuously by the Mauna Loa observatory. The series overlap substantially, but do not cover exactly the same years.
Economist Diane Coyle, who has devoted much of her work to rethinking progress measurement beyond GDP, formulates the problem with precision: cheaper resources lose part of their significance if the natural conditions that make them extractable erode. The time-price of wild fish can fall as trawlers become more efficient, until the stock collapses. Time-price does not capture the tipping point. It captures present abundance, not its sustainability.
This limitation is not an attack on Tupy. He acknowledges it himself, at least partially, by distinguishing between merchant resources and goods that markets do not yet value. But this acknowledgment remains at the edge of the analysis. This limitation does not enter explicitly into the index’s construction.
Two Forms of Progress That Structurally Diverge
The real tension is not between optimists and pessimists. It is between two categories of goods that respond to opposite logics.
Merchant resources improve through innovation and competition: when a resource becomes scarce, its price rises, which incentivizes innovation, substitution, conservation. This is the mechanism Simon had in mind. It works. High oil prices in the 2000s accelerated the development of renewables and energy efficiency. The oil rent itself erodes under pressure from these substitutes.
The market sends signals and actors respond to them.
Non-priced common goods do not automatically benefit from the price mechanism, but institutions and policies can create partial equivalents. Non-market biodiversity generally does not have an automatic global price reflecting its scarcity. CO2 has no automatic price when its atmospheric stock increases, except where public policies have assigned it one. Market signals do not arrive, or arrive too late, or arrive in the form of catastrophes without identifiable buyers or sellers. The 2023 Global Tipping Points Research Group report identifies several thresholds of irreversibility in natural systems—ice melt, Amazon deforestation, ocean acidification—that can be undervalued by markets when damages are externalities difficult to measure or attribute.
This is a structural divergence, not a paradox to be resolved by textual argument. Markets more easily assign prices to goods and rights that are appropriable, exchangeable, and excludable; yet this property does not encompass all their forms or all their functions. Certain global environmental goods, notably climate stability, exhibit characteristics of a global public good; other common resources may be rival and managed through rights or rules. Partially overlapping series simultaneously show an improvement in Simon Index time-prices and a degradation of certain environmental indicators.
Acemoglu and Johnson, in their work on who captures gains from growth, shed useful light here: institutions define which goods are valued and who bears the costs of goods that are not. The economy of innovation generates gains that do not always show up in accounts; non-internalized environmental costs do not automatically appear in prices, even if policies can partially integrate them.
The Practical Implications of Measuring Progress
Building indicators that simultaneously capture merchant abundance and the state of common goods is a serious research program, underway, whose results condition public policies.
Several approaches exist. Natural capital accounts, developed notably by the World Bank under the Wealth of Nations program and by the United Nations’ SEEA (System of Environmental-Economic Accounting) project, attempt to integrate the value of natural stocks in expanded accounting. The objective is to treat ecosystem degradation as asset depreciation, just like an aging factory. These methods exist. They are adopted by around twenty countries.
They do not reach consensus on the values to assign to species or climate cycles, but their existence proves the problem is tractable.
The Genuine Progress Indicator (GPI), developed by several economists as an alternative to GDP, subtracts the costs of environmental degradation and inequality from the wealth flow produced. Studies that calculate it for the United States show growing divergence since the 1970s between GDP and GPI, the former rises, the latter stagnates or falls. These results are debated methodologically, but the direction of the signal is consistent with biodiversity and CO2 data.
Diane Coyle, in her work on measuring the digital economy, defends a complementary approach: constructing dashboards rather than a single synthetic indicator. The idea is that reduction to a single number, GDP, time-price, or otherwise, always generates blind spots. A dashboard simultaneously tracking time-prices of merchant resources, the status of natural capital stocks, ecosystem health indicators, and net emissions would provide a more complete picture. It would also be harder to summarize in a single argument, which perhaps explains its slower adoption.
Toward 2040: The Gap Between Merchant and Natural Accounts
The dynamics at play since 1975 may converge or the two curves may continue to diverge. This horizon constitutes the concrete stakes of the coming decades.
A first scenario is reconciliation through the market. Significant carbon prices, natural capital accounting integrated into company balance sheets, functioning biodiversity markets could progressively internalize the costs of common goods. If deforestation has an accounting cost, if CO2 has a price, if habitat destruction generates a debt recorded on the balance sheet, market signals begin to align with physical reality. Programs like the European Union’s carbon border adjustment mechanism or sovereign green bonds are embryos of this logic. Their scope remains limited; their direction is correct.
A second scenario is that of decoupling. Common goods continue to degrade because their internalization remains politically costly and unevenly distributed. Countries that industrialize late do not have the same institutional capacities or margins to internalize these costs as advanced economies. Biodiversity falls under the Convention on Biological Diversity and the Kunming-Montreal framework; its mechanisms differ from those of the climate regime but are not absent. The 2022 Kunming-Montreal framework, which sets the objective of protecting 30% of land and oceans by 2030, represents real political progress, but its financing and enforcement mechanisms remain insufficient relative to commitments.
In this scenario, the Simon Index continues to progress while ecosystems simplify.
A third scenario, less explored, is that of technological rupture that changes the terms of the problem. If cellular agriculture reduces the land footprint of livestock farming, if bio-based materials substitute for mineral resources, if carbon capture becomes economically viable at scale, pressure on common goods could fall without time-prices increasing. The decline in cultivated land per capita reflects primarily the combined evolution of cultivated area and population; yield increases allowed production growth despite reduced area per person. This partial decoupling between agricultural production and land use could presage broader decoupling. It remains to be built, and its institutional conditions—research funding, technology transfer to countries facing the strongest land pressure—are political choices, not automatic developments.
The signal to watch to distinguish these trajectories by 2030 is simple to formulate, difficult to follow: does the complete cost of production, including natural capital depreciation, converge with the merchant cost observed in time-prices. As long as the two remain decoupled, merchant abundance and non-market degradation can progress together. The stakes of indicators exceed the academic framework: measuring what truly counts for growth conditions the trade-offs societies will be able to make.
The Blind Spots of Lucid Optimism
The Simon Index documents real progress. Denying it would be a factual error and an editorial fault. In the basket of 50 products in the Simon Abundance Index, the average time-price declined sharply between 1980 and 2025. This is good news for the billions of people whose standard of living depends on this access.
But lucid optimism does not content itself with a single metric. It demands looking at what the metric does not see. Biodiversity and climate stability are productive assets: they provide services—pollination, water cycle regulation, carbon absorption—on which the agricultural and industrial systems that lower time-prices depend. Their degradation is not external to merchant progress: it is, ultimately, a limiting condition.
The two data series, abundance of merchant resources, degradation of common goods, do not cancel each other out. They can describe two dimensions of an economic process in which certain environmental costs remain externalized. Building institutions capable of internalizing this remainder, and indicators capable of making it visible, that is the frontier where the next stage of progress is being played out.
Sources
- Marian Tupy, Our Editor’s 2025 End-of-Year Missive, HumanProgress.org, https://humanprogress.org/our-editors-end-of-year-missive/
- Our World in Data, Long-run resource prices and CO2 concentration series, https://ourworldindata.org
- WWF, Living Planet Report 2024 (biodiversity -73% since 1970), no verified direct link
- Scripps Institution of Oceanography / NOAA, Keeling Curve, atmospheric CO2 Mauna Loa, https://scrippsco2.ucsd.edu
- Global Tipping Points Research Group, Global Tipping Points Report 2023, University of Exeter, no verified direct link
- United Nations, System of Environmental-Economic Accounting (SEEA), https://seea.un.org
- Diane Coyle, GDP: A Brief but Affectionate History (Princeton University Press, 2014) and works on measuring progress
- Daron Acemoglu & Simon Johnson, Power and Progress (PublicAffairs, 2023)
- Convention on Biological Diversity, Kunming-Montreal Global Framework (COP15, December 2022), https://www.cbd.int